LIT up in Flames? Or time to get LIT?
The short answer to the headline questions is probably both. So, pick your poison.
In light of the COVID-19 outbreak and subsequent sell-off in markets, it’s appropriate to take stock of worst-case scenario modelling that we undertake on listed debt funds during primary issuances. In our view, there has been much irrational selling in recent weeks. Understandably, markets have struggled to price the unknown impact of the COVID-19 pandemic and collapse in oil prices.
It is not known whether the impact will be as lasting and severe as the Global Financial Crisis (GFC). Nevertheless, we use credit risk data from the GFC to assess what a rational price estimate, would look like for several Listed Investment Trusts (LITs) under our coverage.
Astute market observers will note the omission of some LITs. This is due to either outdated underlying fund data or an outdated analysis compared to our current quantitative methodology. It is not a reflection of the funds and we expect to be in consultation with managers to obtain most recent data to perform this analysis.
If we arbitrarily assume the impact of COVID-19 will not be dissimilar to the GFC, then at current prices attractive opportunities exist. We caveat that this analysis is backwards looking and contains assumptions; several of which, are subjective and have material output impacts. This should not be treated as a forecast of expected future prices, rather, it is the estimated price reaction in a hypothetical GFC-like simulation, based solely on credit risk.
A summary of our observations, as at 23 March 2020:
- MXT appears oversold, with ~47% capital upside potential on our worst-case scenario. ~37% NAV discount. Attractive – largely senior secured loans.
- NBI is trading at ~38% discount to NAV. Whilst attractive, this is for the brave only, given the dislocation and illiquidity on display in High Yield (HY) markets.
- QRI is trading at a ~35% discount to NAV. This seems harsh given current property resilience. We expect the property outlook to deteriorate and this discount to remain range bound.
- KKC is trading at a savage ~43% discount to NAV, with ~63% capital upside potential on our worst-case scenario. KKC struggled to trade at NAV in the good times, however this seems oversold.
- PGG is trading at a brutal ~41% discount to NAV, with ~54% capital upside on our worst-case scenario. Products with weak underlying (asset level) covenants and excessive leverage in a fluid and uncertain environment, should be avoided until better visibility ensues. Wait for fiscal backstops in the US before accumulating.
These curves and lines can seem odd, so to quickly refresh key points:
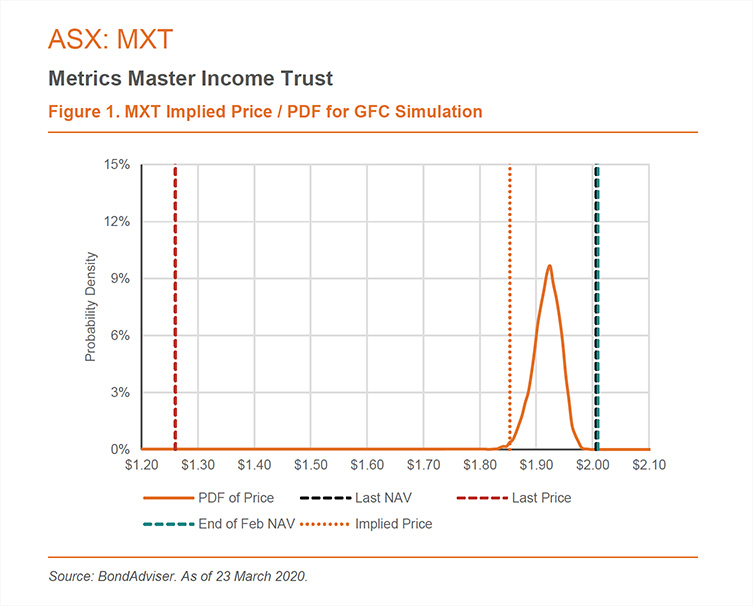
- Probability Density Functions (PDF), specify the probability of a simulation failing within a range of values. The integral space is equal to 1. The mode is the highest peak and the median is where the integral area (cumulative probability) is equal to 0.5. Our orange PDFs illustrate the simulation distribution for our worst-case GFC simulation.
- Our implied price, is a conservative estimate of where, based on GFC-like inputs, a LIT would be valued. Given the COVID-19 outbreak is a 1-in-100 event, our implied price looks at a 1% cumulative probability of simulations. Should the pandemic result in adverse credit migrations and loss given default (LGD) outcomes that are more severe than the GFC, the analysis is spurious for predictive purposes.
MXT provides exposure to the Australian corporate loan market. It has a net (after fees) target return of the RBA cash rate plus 3.25% p.a. We expect MXT to exhibit resilience to capital loss, given on a look-through basis, it contains >140 unique borrowers, mitigating the impact of any single adverse outcome. On 31 December 2019, average counter-party exposure by portfolio value was 0.7%.
About 45% of the portfolio by value is real estate based. Whilst comfortable with this given strict origination and guarantee requirements, our simulations may exhibit a high margin of error. This is because of a lack of explicit correlation. In the event of a severe property downturn, the probability and severity of default would be higher – this because we utilise GFC data that encompass the entire corporate universe, rather than data that is specific to the property industry during the GFC.
MXT benefits in our modelling given ~75% of loans are senior secured, deriving significantly better loss given default outcomes than bonds. It also benefits from a short average tenor (2.5 years), which, in the event of an adverse mark-to-market revaluation results is a smaller quantum of cashflows revalued with a higher discount rate.
At last price of $1.26, MXT appears to provide excellent value, given our worst-case GFC simulation price of $1.85 – representing a conservative upside potential of a 47% capital gain. It is not unreasonable to suggest that MXT may experience capital loss, but given its success in turnarounds, we expect the ultimate NAV impact to be insignificant.
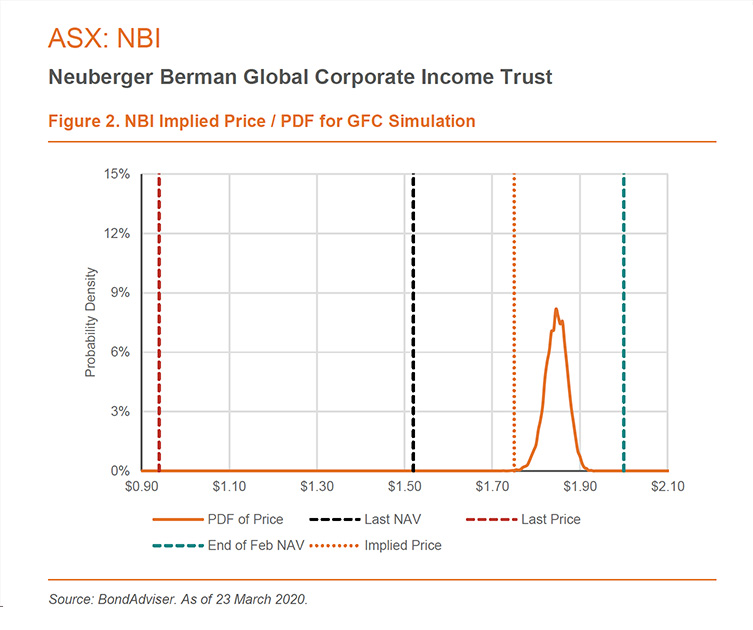
NBI provides exposure to the global high-yield bond market. It has a net target return of 5.25% p.a. Neuberger Berman’s success with this strategy is well documented, its non-investment grade credit platform has only experienced 1 default since 1998, whereas the global high-yield market has experienced over 1,500 defaults in the same period.
As of 29 February 2020, only 7% of the portfolio had direct exposure to energy credit – a distinct positive considering the >60% collapse in oil prices year-to-date (YTD).
Unfortunately, HY spreads have soared in recent weeks, from 360bps to >1,000bps. The Bloomberg Barclays US Corporate High Yield index is down ~18% YTD. Given the last NAV of $1.52 for NBI, it is currently underperforming the benchmark.
On the surface, our modelling here looks like a big swing and miss. However, we highlight it is a 1-year simulation, that uses the average of probabilities and spreads in 2008/09 – rather than the single worst point in time, which arguably, is close, if not now. Given such, as markets gain greater visibility over COVID-19 and broader fixed-income liquidity improves, we expect some normalisation to our modelling. Our modeling only accounts for credit risk, it does not account for liquidity (or lack-thereof). Probability of default, loss given default and adverse credit rating migration probabilities are the key drivers of our model. Our implied price does not account for liquidity induced mark-to-market volatility.
We are not convinced the illiquidity issues in credit trading have fully manifested yet in global high yield markets. Although a 38% discount to NAV, and 46% discount to our 1-year implied price looks to provide exceptional value, our view is that dislocation and volatility may continue for the next month, as the quantum of earnings downgrades is processed. We note positively, media, telecommunications, healthcare, technology, chemicals and utilities make up 37% of the portfolio. These are sectors which we expect to rebound quickly given their non-discretionary nature.
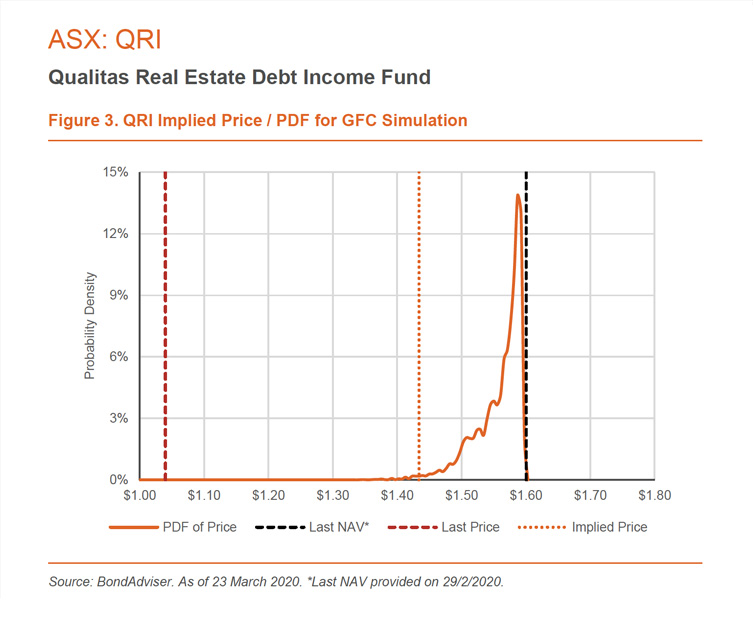
QRI provides exposure to a portfolio of senior and mezzanine loans across the commercial and residential real estate market in Australia. It has a net target return of 8% p.a. Qualitas has a 12-year track record of alternative financing across the spectrum of real-estate lending.
Although the housing market in Australia remains resilient, a lasting economic impact of COVID-19 seems evermore likely. As such, we expect unemployment to increase and for Australia to enter a recession in the coming months. Unfortunately, property is at the forefront of any subsequent economic fallout.
Our modelling for QRI is more complicated (and therefore subject to additional error) because no internal or external credit ratings are available for the underlying securities. We assign a proxy rating based on S&P’s mapping for CMBS based on LVRs – in our worst-case scenario we assume all securities map to a sub-investment grade rating.
QRI’s modelling benefits from a large cash balance (17% at model date, 14% at 29 February 2020), anchoring the portfolio closer to an expected loss of zero. QRI also benefits from a short average tenor (1.5 years) and majority of senior secured loans by portfolio value.
QRI currently trades at a ~35% discount to NAV. Our worst-case GFC simulation price of $1.43, embeds a ~38% expected capital gain. As COVID-19 panic ramps up in Australia with a blow-out of cases forecasted in the next two weeks, it is difficult to see any upside narrative to local property markets. As the impact is felt on the domestic economy, albeit temporarily, we don’t see a compelling case for a quick rebound towards NAV. At the margin, we would be an incremental buyer at current prices, with the expectation of a slow compression to NAV.
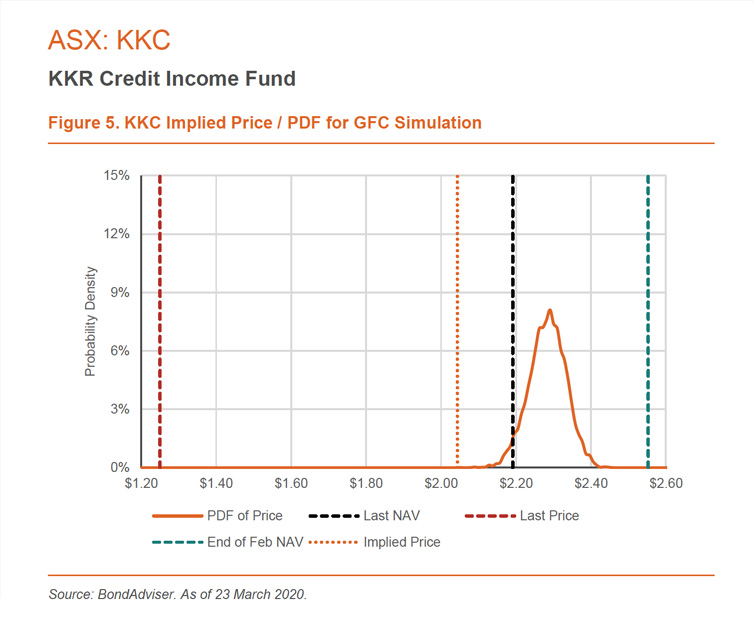
KKC provides exposure to KKR’s credit product suite, including the flagship global credit opportunities fund (GCOF) and the European direct lending fund (EDL). It has a net target return range of 6-8% p.a.
As the ramp up of EDL continues, we expect further NAV stability. GCOF currently makes up 88% of KKC. Positively, GCOF has low exposure to travel businesses, with most of the portfolio focused in defensive sectors such as healthcare, software, services and capital goods. KKC has only 4% exposure to energy and has remained underweight in the precipitous sector since inception.
Both the high yield and leveraged loan markets have materially sold off. The Responsible Entity provided an out-of-cycle NAV update of 16 March 2020, estimating a NAV per unit of A$2.1914. This represents a is a 15% drop in NAV since the end of March. Meanwhile, the high yield index is down 18% and the leveraged loan index down 20% (both YTD). KKC is trading at a ~43% discount to NAV, with ~63% capital upside potential on our worst-case scenario.
The leveraged loan and high yield market are unlikely to find support until, on global scale, the COVID-19 fear subsides, and a clear fiscal backstop emerges. Illiquidity, forced-selling and uncertainty have a firm grip on markets, making continued stress probable. For non-bank players, such as KKR, this provides a perfect storm to opportunistically add risk where irrational dislocation has occurred. The strength of the KKR platform, in our view, should now be best demonstrated to investors, albeit an improvement in performance may take time. Although it is difficult to work against the grain, accumulation here in anticipation of an upturn should be well compensated for the bold.
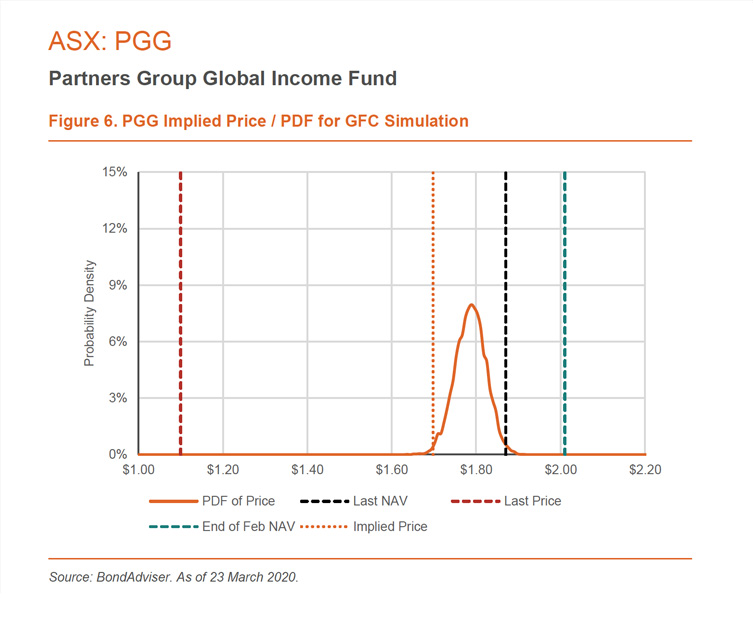
PGG provides exposure to a global portfolio of private loans across the capital structure. This is predominantly made of up first lien leveraged loans. It has a net target return of RBA cash rate plus 4% p.a.
Partners Group has placed strong emphasis on capital preservation, reflected through its lower average annual capital loss rates for first lien loans (0.43% p.a.) and second lien loans (0.20% p.a.) since 2007 and 2006 respectively.
PGG is trading at a ~41% discount to NAV, with ~23% capital upside on our worst-case scenario. Since the end of February 2020, NAV has fallen 7%, suggesting Partners Group have done a solid job of managing risk, given the leveraged loan index is down 18% month-to-date.
We are concerned by the leverage loan market, given the erosion of covenant controls and deteriorating debt metrics that has occurred over the past ten years. For clarity, our unease is in the broadly syndicate market in the US. Until a better system stability is demonstrated and broader fiscal support is provided, principally in the US but also in Europe, we would prefer to wait for a more attractive entry point and expect the NAV to fall further.
General Disclosures
BondAdviser has acted on information provided to it and our research is subject to change based on legal offering documents. This research is for informational purposes only.
This information discusses general market activity, industry or sector trends, or other broad-based economic, market or political conditions and should not be construed as research or investment advice.
The content of this report is not intended to provide financial product advice and must not be relied upon as such. The Content and the Reports are not and shall not be construed as financial product advice. The statements and/or recommendations on this web application, the Content and/or the Reports are our opinions only. We do not express any opinion on the future or expected value of any Security and do not explicitly or implicitly recommend or suggest an investment strategy of any kind.
The content and reports provided have been prepared based on available data to which we have access. Neither the accuracy of that data nor the methodology used to produce the report can be guaranteed or warranted. Some of the research used to create the content is based on past performance. Past performance is not an indicator of future performance. We have taken all reasonable steps to ensure that any opinion or recommendation is based on reasonable grounds. The data generated by the research is based on methodology that has limitations; and some of the information in the reports is based on information from third parties.
We do not guarantee the currency of the report. If you would like to assess the currency, you should compare the reports with more recent characteristics and performance of the assets mentioned within it. You acknowledge that investment can give rise to substantial risk and a product mentioned in the reports may not be suitable to you.
You should obtain independent advice specific to your circumstances, make your own enquiries and satisfy yourself before you make any investment decisions or use the report for any purpose. This report provides general information only. There has been no regard whatsoever to your own personal or business needs, your individual circumstances, your own financial position or investment objectives in preparing the information.
We do not accept responsibility for any loss or damage, however caused (including through negligence), which you may directly or indirectly suffer in connection with your use of this report, nor do we accept any responsibility for any such loss arising out of your use of, or reliance on, information contained on or accessed through this report.
© 2020 Bond Adviser Pty Ltd. All rights reserved.
BondAdvisor – 24 March 2020
Other News

Podcast: The Rules of Investing | From Cold Call to Capital Giant
In this episode of The Rules of Investing, Metrics Group CEO & Managing Partner, Andrew Lockhart discusses the conditions that…

Metrics Credit Partners Completes Acquisition of Taurus and BC Invest
Metrics Credit Partners (“Metrics”), a leading Australian based alternative asset management firm, has today successfully completed the acquisition of Taurus…
INSIGHTS

MCP Income Opportunities Trust (MOT) lists on ASX
Sydney, 29 April 2019: The Trust Company (RE Services) Limited (ABN 45 003 278 831) (Responsible Entity) is the responsible…

MCP Master Income Trust wins Lonsec Listed Fund Award
The award came a year after MXT was listed on the Australian Securities Exchange